Statistics and trading journal
Statistics shows what actually works in your trading and what does not. It is based on your trades, from recommendations and manual journal entries.
Trade type
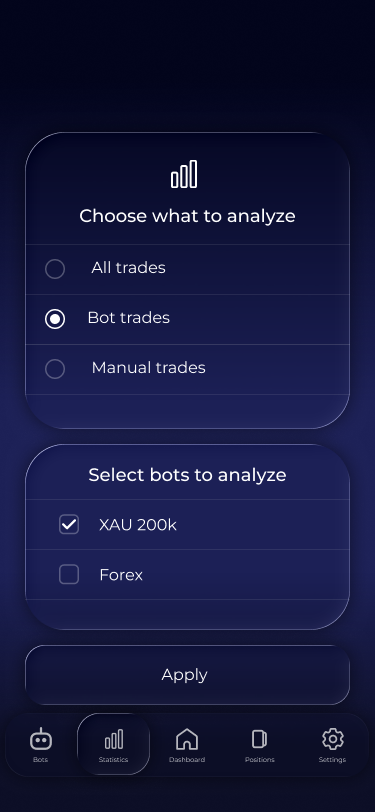
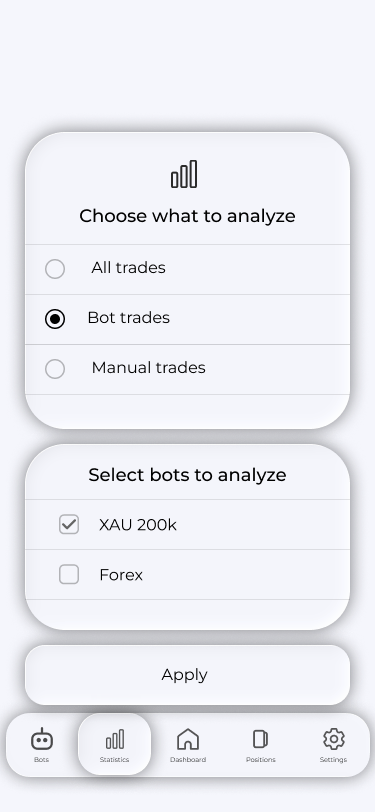
On entering Statistics, choose what to analyse: All Trades, Bot Trades with a specific bot selection, or Manual Trades. Apply opens statistics for the selected trade type.
Overall statistics
This is an overview of trade performance. Total Profit is at the top, followed by the same charts and metric cards as a backtest: deposit curve, win rate, profit factor, Sharpe, Sortino, drawdown and streaks, calculated from live closed trades.


Trade statistics
Scroll down to view detailed statistics for each closed trade. Tap a trade to see:
- Opening and closing time;
- Overall statistics and earnings;
- Trade analysis if it followed a bot's instructions;
- Personal notes;
- A chart showing the trade with SL and TP.
Use Edit Positions Details to change a specific trade.
Tip: Review losing trades in detailed statistics once a week. Breakdowns by hour and POI often reveal problems faster than the overall chart.


Frequently asked questions
Why are trades displayed in UTC?
Trade times are displayed in UTC by default. If you prefer another time zone, choose it in Settings → Time Zone. See Account and settings for details.
Can I view statistics for several bots at once?
Yes. Choose All Trades to view combined statistics for all your trades, including trades from different bots.
Which metrics does my plan include?
Professional metrics and detailed analytics depend on your plan—see Plans.